2025 Performance
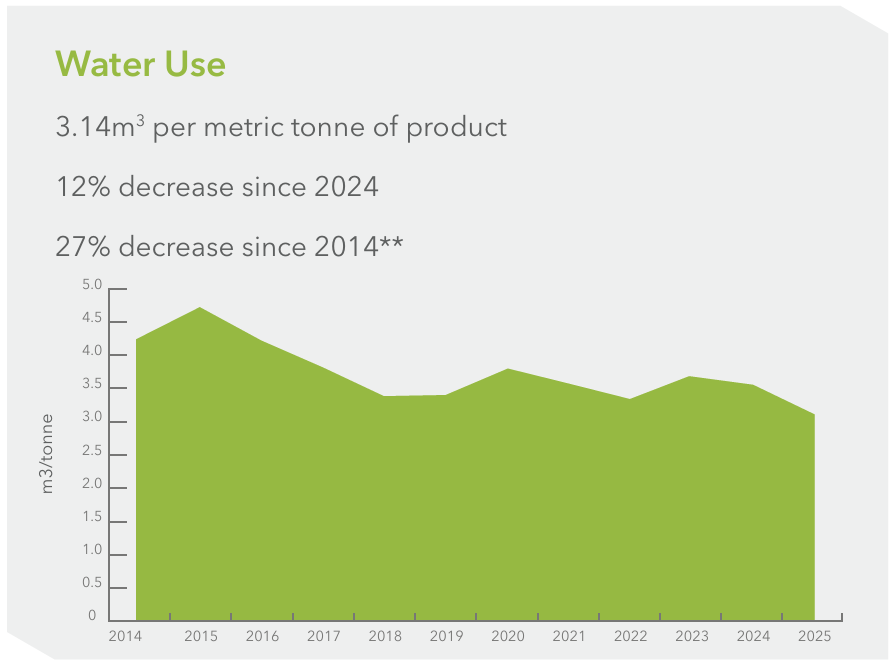
In 2025, water intensity decreased by 12% compared with 2024 and 27% compared with the 2014 baseline. This improvement reflects the resolution of temporary operational constraints occurring in 2024, improved measurement accuracy, changes in product mix, and adjustments to production volumes across the business.
Total Water Discharge (2025)
| Water Source | Amount of water discharge (m3) |
|---|---|
| Fresh surface water | 685,297 |
| Brackish surface water / sea water | 0 |
| Ground water | 6,882 |
| Third party sources | 510,718 |
| Total wastewater discharge | 1,202,897 |
Total Water Withdrawn (2025)
| Water Source | Amount of water withdrawn (m3) |
|---|---|
| Fresh surface water | 186,570 |
| Brackish surface water / sea water | 0 |
| Renewable ground water | 873,975 |
| Non-renewable ground water | 317,041 |
| Produced water | 415 |
| Third party sources | 508,680 |
<br>
<br>
Total Water Consumption (2025): 683,784 m3
<br>
Assessing water risk
*As defined by the Water Resources Institute (WRI) Aqueduct Water Risk Atlas. Go to Aqueduct Water Risk Atlas World Resources Institute (wri.org) for more information.
Reducing our water use
- Castiglione, Italy
- Midland, Pleasanton + Oklahoma, US
Castiglione, Italy
Improvements have been made to improve the efficiency of the onsite bio-treatment plant. The build-up of foam in the lagoons reduced the breakdown of CO2. A series of water jets were installed to spray over lagoon to reduce the foam. Initially fed with fresh well water the site were able instead to recover clean water flowing from the bio station itself and use it to feed the spray system. In total this will save 18,000 m3 of water per year.
Midland, Pleasanton + Oklahoma, US
All flush water at the site is now being reused back in blends. This water was previously discarded and a one-time use. The amount of water this saves is tracked by monthly supervisor reports and this equates to over 904m3 of water recycled in 2024.